By Lawrence Edem ZIKPI
\xa0 Over the years, Ghana has encountered numerous economic difficulties. As a result, the nation has sought outside help, including financial backing from global entities like the World Bank and the International Monetary Fund (IMF).
These issues resulted in the implementation of the DDEP, which consequently caused the devaluation of the cedi relative to the dollar and various key currencies, along with soaring inflation rates within the nation.
The implementation of the DDEP caused investors to lose trust in the bond market, resulting in sustained lackluster appeal over time. The country’s financial sector has seen varied reactions, with investors proceeding with caution through a landscape marked by ambiguity.
To address these issues, the Bank of Ghana launched the Ghana Gold Coin (GGC) primarily for two purposes: first, to absorb surplus liquidity in order to alleviate pressure on the US dollar, thereby preventing depreciation of the cedi and reducing high inflation rates; secondly, to introduce an additional investment option into our current financial marketplace.
Over the years, gold has shown significant strength as an international financial asset and acts as a natural safeguard during economic instability. By issuing the GGC, access to this stable investment is provided, allowing residents to broaden their financial holdings.
The purpose of the GGC issuance was to allow the BoG to absorb extra cedi liquidity from the banking sector, complementing the utilization of Bank of Ghana bills and overnight deposits as part of its open market operations.
Within this research, the GGC signifies a novel investment opportunity within the nation’s financial sector; consequently, it holds the potential to influence Ghana's market dynamics significantly.
To evaluate this effect, the research analyzes the performance of the Coin from the date when the Bank of Ghana introduced it on September 27, 2024, and began trading activities in November 2024. The investigation delves into how markets have reacted and measures resulting price fluctuations using data from the prior day’s LBMA PM fix as an indicator for examining trends over time.
Trend analysis is frequently employed in finance to scrutinize and assess data, uncovering patterns to make educated forecasts about forthcoming shifts in particular occurrences linked to asset values and market activities.
The research examines the trends in GGC pricing during particular timeframes to develop possible investment approaches and ways for investors to incorporate these into their current holdings from the Bank of Ghana. Additionally, it seeks to assess the effectiveness of using the GGC as an alternative hedge compared to the USD, aiming to reduce pressure on the dollar and consequently bolster the value of the Ghanaian cedi.
Methodology
This document utilizes trend analysis to assess the performance of the GGC since its launch at the London Bullion Market on November 25, 2024. We also contrast this performance with changes in the value of the US dollar relative to the USD/GHS exchange rate and fluctuations in international gold prices.
To comprehensively assess the coin’s performance, we consolidate information from multiple sources with differing measurement units to enhance consistency. Additionally, we utilize certain models for measuring returns. Particularly, when the time frame of our data spans under one year, we calculate standard returns through the Holding Period Return method to gauge how fund inflows and outflows affect the measurements, as this approach minimizes the impact of such transactions on the overall portfolio value.
Data and Summary Statistics
We gather daily information from these two primary markets. Regarding gold prices, we utilize the LBMA PM fix price from the preceding business day. In terms of foreign exchange rates, we rely on the Bloomberg REGN Mid-Rate for the USDGHS currency pair. We selected May 30, 2025, as our end date because this point represents exactly six months after the commencement of GGC trading on the London Bullion Market in November 2024, aligning with the duration specified in our research analysis.
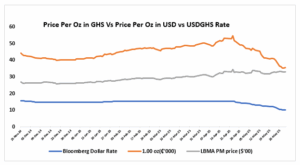
As shown in Figure 1, the chart depicts the historical daily closing price sequence for the GGC using LBMA PM rates denominated in cedis alongside its value expressed in dollars according to the Bloomberg REGN Mid-Rate USDGHS exchange rate. According to Figure 1, during this timeframe, the Bloomberg USD/GHS rate declined (indicating an appreciation of the cedi), moving from around 15.8 at the end of November 2024 down to 10.30 by May 30, 2025.
The LBMA PM gold price rose from $2,694.95 to $3,312.40 (measured in U.S. dollars per ounce). Over this time frame, the Ghana 1-ounce coin saw considerable fluctuation in pricing. Initially dropping from GH¢46,155 on November 25 to GH¢42,390 by December 2, it then surged to an apex of approximately GH¢54,806.36 by April 23 before settling at GH¢35,696.75 as of May 30.
Typically, an increase in the LBMA gold price has the effect of raising the local gold-coin price. Conversely, a more robust cedi (indicating a lower USD/GHS rate) usually exerts downward pressure on the same. Over this timeframe, however, there wasn’t a straightforward linear relationship between the USD/GHS exchange rate and the LBMA pricing.
For example, by early May, the LBMA gold price was near its high, while USD/GHS was at its low (a strong cedi). In other words, gold prices and the Ghana cedi moved somewhat inversely; that is, when LBMA rose, it put upward pressure on the gold-coin price in cedis, but when USD/GHS fell, it offset some of that increase.
The value of the coin showed considerable fluctuation. A notable drop occurred between late November and early December 2024, during which the gold coin lost approximately 8% within one week. This phase saw a discrepancy as well; while the LBMA price remained nearly stable, the local currency appreciated. Between January and April 2025, both the coin’s price and global gold prices on the LBMA displayed an increasing trend.
In late April 2025, the peak occurred when LBMA rose above $3,100 to reach $3,433.55 on April 23rd. Then, at the beginning of May, the cryptocurrency’s value started declining sharply due to the rapid strengthening of the cedi (as evidenced by a drop in the USD/GHS exchange rate). Despite this shift, LBMA prices stayed close to their elevated levels.
In general, the fluctuations in the price of gold coins are due to a mix of increasing global gold prices and changes in the value of the cedi. Specifically, when the international gold price goes up along with a robust US dollar, the price of the Ghanaian gold coin also climbs. Conversely, if the cedi strengthens, this tends to lower the local cost of these coins.
However, when the global gold price rises at a rate faster and broader than the rate of cedi appreciation, it offsets the difference, which is reflected in the rising prices of the Ghana gold coin.
From November 2024 through May 2025, the Ghanaian cedi gained strength relative to the US dollar (as indicated by a decrease in USD/GHS rates). During this time, international gold prices increased, while the pricing of the Ghana Gold Coin showed varied movements, influenced by both factors.
The chart illustrates contrasting movements: LBMA gold shows a steady increase, USD/GHS decreases progressively, and the Ghana gold coin experiences more volatile fluctuations. It reacts to the decline of USD/GHS at a rate quicker than the escalation in international gold prices.
Although the appreciation of the cedi relative to the US dollar played a significant role in introducing the GGC, this strength can diminish the value of the gold coin when escalating global gold prices fail to compensate for the gap caused by the cedi’s increased worth compared to the dollar.
Figure 1: Historical Trend Showing the Price Per Ounce of GGC in Cedis Versus Dollars According to the LBMA Prices and the Exchange Rate Between Cedis and Dollars.
The line chart depicted from November 25, 2024, to May 30, 2025, illustrates three distinct data sets: the Bloomberg USD/GHS exchange rate (in blue), the cost of one ounce of the Ghana Gold Coin measured in thousands of cedis (marked orange), and the LBMA PM gold price shown in hundreds of U.S. dollars (represented in grey). The pricing for the Ghana Gold Coin is denoted as GH¢'000 per ounce, whereas the LBMA PM gold is indicated at USD '00 across the period from November 2024 to May 2025.
The table demonstrates the connection between international and domestic gold prices along with the impact of currency exchange rates. It highlights a significant positive correlation between the LBMA gold price and the Ghanaian cedi (GH₵) gold coin price, indicating that local gold pricing closely aligns with worldwide market movements.
There is a positive connection between the USD/GHS exchange rate and the cost of gold coins, suggesting that changes in this exchange rate can affect local gold pricing. However, the relationship between the USD/GHS exchange rate and the LBMA gold price is minimal, showing that worldwide gold prices remain largely unaffected by shifts in Ghana’s currency. Consequently, those investing in gold within Ghana tend to be more swayed by global gold price trends than by variations in their country’s foreign exchange rates.
|
Pairwise Comparison |
Expected Sign |
Actual Correlation |
|
LBMA Compared to GH₵ Gold Coin Pricing |
Positive |
Very High (+) |
|
USD/GHS compared to the GH₵ Gold Coin price |
Positive |
Moderate (+) |
|
USD/GHS compared to the LBMA Gold Price |
Insignificant |
Low/Negligible |
The data presented in the table above illustrates the comparative analysis between the LMBA gold price, the Bloomberg USD/GHS exchange rate, and the pricing of the Ghana Gold Coins.
\xa0
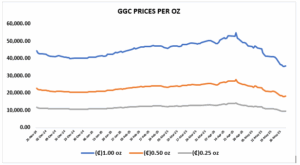
Figure 1: Historical Trend of the Price Per Ounce for GGC
The chart displayed (covering dates from November 25, 2024, to May 30, 2025) illustrates three sets of data: the pricing trends for the 1 oz, 0.50 oz, and 0.25 oz Ghana Gold Coins, measured in thousands of cedis. This information was obtained from the official site of the Bank of Ghana for the period spanning November 2024 through May 2025.
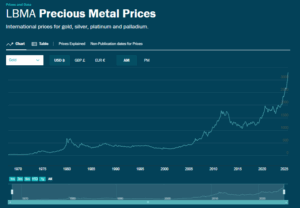
Regarding the duration for which the GGC has operated since its introduction, it’s crucial to highlight that the GGC pricing methodology aligns with an established market pattern depicted in the chart below. This pattern represents the London Bullion Market Association (LBMA) PM Fix price, which has been active for the last 57 years, spanning from January 1968 up until now.
GGC's price foundation lies in the prior day’s LBMA evening fix price. For GGC, this value is denominated in US dollars relative to the Ghana cedi exchange rate, as determined by the preceding day's closing Bloomberg REGN Mid-Rate quotation.
This suggests that under similar conditions, the GGC’s future performance could potentially be forecast based on the historical performance of the LBMA over the years.
Figure 5: 10-Year Historical Trend of Gold Price per Ounce at the London Bullion Market in US Dollars
\xa0
The line chart depicted (ranging from January 1968 to May 30, 2025) illustrates the historical performance of gold throughout the last 57 years.
From November 2024 through May 2025, the pricing patterns of gold coins denominated in Ghanaian cedi exhibited distinct fluctuations for each size. For example, the price of a 1.00 oz gold coin rose from ₵42,620.57 in November 2024 to ₵49,250.81 in March 2025, marking an overall increase of 15.56 percent.
Although there was a short downturn in December 2024, the price of gold coins surged dramatically from January up until reaching its apex in April 2025 before plummeting considerably by the end of May 2025 to ₵35,696.75. Despite the rise in global gold prices, this decrease happened because the cedi appreciated approximately 35% against the dollar according to the Bloomberg cedi-to-dollar exchange rate as of May 30, 2025.
Despite the LBMA PM gold price climbing steeply from $2,641.85 in November to $3,312.40 in May, reflecting an impressive 22.91% growth, the sluggish movement of the USD/CHF exchange rate considerably diminished the coin’s value locally. The significant jump in international gold pricing primarily fueled the escalation in the cost of cedi-denominated gold coins between January and April.
However, by the end of May, the strengthening of the cedi exerted downward pressure on local prices. The consistent and significant rise in global gold prices was offset by the appreciation of the cedi against the dollar, resulting in a negative Holding Period Return in the local market value of gold coins.
Table 1: Past Month-to-Month Closing Prices of Gold Coin at the London Bullion Market.
|
PERIOD |
(₵)1.00 oz |
(₵)0.50 oz |
(₵)0.25 oz |
Bloomberg Dollar Rate |
LBMA PM price ($) |
|
29-Nov-24 |
44,403.68 |
22,607.09 |
11,740.88 |
15.80 |
2,694.95 |
|
31-Dec-24 |
40,169.31 |
20,486.68 |
10,675.23 |
14.70 |
2,609.10 |
|
31-Jan-25 |
44,507.86 |
22,665.10 |
11,774.80 |
15.30 |
2,787.25 |
|
28-Feb-25 |
46,526.69 |
23,677.54 |
12,284.44 |
15.50 |
2,880.80 |
|
28-Mar-25 |
49,250.81 |
25,039.60 |
12,965.47 |
15.50 |
3,056.55 |
|
30-Apr-25 |
48,900.28 |
24,845.44 |
12,847.00 |
14.25 |
3,305.05 |
|
30-May-25 |
35,696.75 |
18,183.97 |
9,448.66 |
10.30 |
3,312.40 |
|
HPR% |
-19.61% |
-19.57% |
-19.52% |
-34.81% |
22.91% |
The chart provided from November 29, 2024, to May 30, 2025, illustrates three weight categories within the GGC’s valuation methodology: 1 ounce, 0.50 ounces, and 0.25 ounces, all listed in thousands of cedis. It also includes the Bloomberg USD/GHS exchange rate along with the LBMA PM gold price quoted in hundreds of U.S. dollars.
The table offers a comparison between the performance and risk profile of gold priced in Ghanaian cedis (₵1.00 oz) and the international LBMA PM price denominated in U.S. dollars. During the evaluation period, the local gold investment showed a negative holding period return of 19.61%, signaling a considerable decrease in value. In contrast, the LBMA PM gold price demonstrated a positive return of 22.91%, indicative of an increase.
In terms of volatility, the standard deviation of the log returns indicates that the local gold price was significantly more volatile (0.907%) than its international counterpart (0.783%), suggesting higher price fluctuations and greater risk for local investors.
Even so, the average and midpoint values for regional gold pricing (₵44,867.94 and ₵45,486.48) remained fairly steady but could experience considerable fluctuations over shorter periods. In contrast, the LBMA gold prices demonstrated greater stability, averaging at $2,937.16 with a median of $2,916.10.
Ultimately, the maximum drawdown, indicating the most significant drop from peak to trough, was much deeper for the local price at -34.87%, as opposed to only -3.66% for the LBMA price. This suggests that investors holding gold in Ghanaian cedis experienced substantially greater potential losses over this timeframe. In summary, these findings imply that the LBMA PM gold price offered superior performance along with reduced risk, positioning it as a more consistent and appealing option when contrasted against the domestic market.
Table 2: From Start Date to Closing Prices as of 30th th In May 2025, gold coins were traded on the London Bullion Market.
|
PERIOD |
(₵)1.00 oz |
(₵)0.50 oz |
(₵)0.25 oz |
Bloomberg Dollar Rate |
LBMA PM price ($) |
|
25-Nov-24 |
44,403.68 |
22,607.09 |
11,740.88 |
15.80 |
2,694.95 |
|
23-Apr-25** |
54,806.36** |
27,816.13** |
14,352.32** |
15.42 |
3,433.55** |
|
30-May-25 |
35,696.75 |
18,183.97 |
9,448.66 |
10.30 |
3,312.40 |
|
HPR% |
-19.61% |
-19.57% |
-19.52% |
-34.81% |
22.91% |
The data presented in the table spanning from November 25, 2024, to May 25, 2025, illustrates the performance of the GGC since its initial trading date up until this review period. This chart details the three weight categories used within the GGC’s valuation methodology—namely, 1 ounce, 0.50 ounces, and 0.25 ounces—all expressed in thousands of Ghanaian cedis. Additionally, it includes the Bloomberg USD/GHS currency conversion rate as well as the LBMA PM gold benchmark price quoted in hundred-dollar increments. Notably, an apex point can be observed around April 23rd, highlighting a significant high over these six months.
|
Metric |
₵1.00 oz (Local) |
LBMA PM ($) |
|
Holding Period Return |
-19.61% |
22.91% |
|
Volatility (Standard Deviation of Log Returns) |
0.907% (High) |
0.783%(Low) |
|
Mean Price |
₵44,867.94 |
$2,937.16 |
|
Median Price |
₵45,486.48 |
$2,916.10 |
|
Maximum Drawdown |
-34.87% |
-3.53% |
Table 2: Past Week-to-Week Closing Prices of Gold Coin at the London Bullion Market
|
PERIOD |
(₵)1.00 oz |
(₵)0.50 oz |
(₵)0.25 oz |
Bloomberg Dollar Rate |
LBMA PM price ($) |
|
25-Nov-24 |
44,403.68 |
22,607.09 |
11,740.88 |
15.800 |
2,694.95 |
|
29-Nov-24 |
42,620.57 |
21,723.35 |
11,306.06 |
15.425 |
2,641.85 |
|
5-Dec-24 |
41,305.11 |
21,057.68 |
10,964.24 |
14.900 |
2,648.65 |
|
13-Dec-24 |
41,206.58 |
21,004.94 |
10,933.94 |
14.670 |
2,684.35 |
|
20-Dec-24 |
39,937.88 |
20,371.04 |
10,617.50 |
14.700 |
2,592.05 |
|
27-Dec-24 |
40,245.05 |
20,524.59 |
10,694.23 |
14.698 |
2,613.80 |
|
3-Jan-25 |
40,715.96 |
20,760.01 |
10,811.90 |
14.695 |
2,646.30 |
|
10-Jan-25 |
41,282.05 |
21,043.89 |
10,954.78 |
14.750 |
2,674.60 |
|
17-Jan-25 |
42,316.07 |
21,563.16 |
11,216.98 |
14.900 |
2,716.50 |
|
24-Jan-25 |
43,324.76 |
22,070.72 |
11,474.40 |
15.113 |
2,744.25 |
|
31-Jan-25 |
44,507.86 |
22,665.10 |
11,774.80 |
15.300 |
2,787.25 |
|
7-Feb-25 |
45,624.64 |
23,225.19 |
12,056.77 |
15.413 |
2,838.95 |
|
14-Feb-25 |
46,912.83 |
23,869.86 |
12,379.74 |
15.450 |
2,915.30 |
|
21-Feb-25 |
47,321.06 |
24,074.73 |
12,483.04 |
15.500 |
2,932.05 |
|
28-Feb-25 |
46,526.69 |
23,677.54 |
12,284.44 |
15.500 |
2,880.80 |
|
7-Mar-25 |
47,168.39 |
23,998.39 |
12,444.87 |
15.500 |
2,922.20 |
|
14-Mar-25 |
47,972.06 |
24,400.23 |
12,645.79 |
15.500 |
2,974.05 |
|
21-Mar-25 |
48,965.61 |
24,897.00 |
12,894.17 |
15.500 |
3,038.15 |
|
28-Mar-25 |
49,250.81 |
25,039.60 |
12,965.47 |
15.500 |
3,056.55 |
|
4-Apr-25 |
50,204.84 |
25,516.62 |
13,203.98 |
15.500 |
3,118.10 |
|
11-Apr-25 |
50,593.11 |
25,710.75 |
13,301.05 |
15.500 |
3,143.15 |
|
17-Apr-25 |
53,294.75 |
27,061.19 |
13,975.84 |
15.475 |
3,322.90 |
|
25-Apr-25 |
51,145.71 |
25,977.60 |
13,423.78 |
14.875 |
3,314.75 |
|
2-May-25 |
47,286.35 |
24,036.96 |
12,441.05 |
14.150 |
3,214.75 |
|
9-May-25 |
45,994.05 |
23,376.46 |
12,094.54 |
13.200 |
3,352.30 |
|
16-May-25 |
41,348.49 |
21,041.96 |
10,914.02 |
12.425 |
3,191.05 |
|
23-May-25 |
39,830.77 |
20,271.01 |
10,514.85 |
11.625 |
3,284.00 |
|
30-May-25 |
35,696.75 |
18,183.97 |
9,448.66 |
10.300 |
3,312.40 |
|
HPR% |
-19.61% |
-19.57% |
-19.52% |
-34.81% |
22.91% |
The chart provided from November 29, 2024, until May 30, 2025, displays the weekly pricing for the GGC across three weight categories: 1 ounce, 0.50 ounces, and 0.25 ounces, with values listed in thousands of Ghanaian cedis. Additionally, it includes the Bloomberg USD/GHS exchange rate along with the LBMA PM gold price expressed in hundreds of U.S. dollars.
Discovered Hindrances
For many years, gold has been recognized as an exceptional financial asset and a solid safeguard against rising prices and economic instability. The Bank of Ghana’s choice to introduce the Ghana Gold Coin (GGC) marks a significant step toward expanding financial tools and encouraging domestic investments in valuable minerals. Nonetheless, there remains a fundamental pricing issue that might erode investors' trust over time.
In contrast to markets where gold investments are quoted in US dollars and currency fluctuation does not affect them, the GGC is valued in Ghanaian cedis. Its worth is calculated based on the LBMA spot price for gold, adjusted according to the current USD/GHS exchange rate. As such, this conversion process makes the value of the gold coin particularly susceptible to changes in the forex market.
An empirical examination of market trends from the last six months indicates that when the Ghanaian cedi strengthens relative to the U.S. dollar, the domestic valuation of the GGC frequently decreases. This decline tends to occur especially when the LBMA gold price either stays stable or doesn’t rise notably, failing to offset the impact of the currency’s appreciation. As an example, th In May, the UK observed a holiday, yet the cost of gold stayed consistent for 26 days. th and 27 th .
Nevertheless, the GGC market price fell as a result of the cedi appreciating over that timeframe. This opposing dynamic carries an underlying risk: those who buy the coin when the cedi is weak (meaning a more expensive USD/GHS exchange rate) could face mark-to-market losses should the cedi later strengthen.
While the strengthening of the cedi offers macroeconomic advantages, including reduced expenses for imports and improved general economic stability, it also negatively affects owners of GGCs, thus discouraging local investments in this asset.
To address this problem, it is crucial for the BoG to adopt the approach utilized by the LBMA in setting global gold prices. This would ensure that the coin’s price is denominated exclusively in Ghanaian cedi, thereby preventing investors from facing depreciation of their investments due to currency fluctuations.
For example, the table below simulates a scenario where the GGC price fluctuates following the same growth rate as gold prices on the LBMA.
The simulation demonstrates that utilizing a valuation model based on the LBMA PM gold price growth rate provides greater accuracy and stability compared to depending on exchange rate changes when assessing the genuine worth of the GGC. By synchronizing local prices with international gold market dynamics, this method shields against the unpredictability of currency markets, which frequently misrepresent asset valuations.
When comparing both methods (growth rate and exchange rate for valuation), we see that although gold increased in value globally, using exchange rates showed a decline in the local cedi value of the coin. This discouraged potential investors and weakened the effectiveness of the GGC.
Nevertheless, the growth rate model enhances investor confidence by demonstrating steady returns and also illustrates the genuine performance and significance of the GGC. Ultimately, this model guarantees that gold coins retain their inherent value irrespective of external macroeconomic pressures.
Table 2: Monthly Simulation of GGC Prices Using the Growth Rate from LBMA Instead of Exchange Rate Volatility
|
PERIOD |
(₵)1.00 oz (Simulated) |
(₵)1.00 oz (Actual) |
Bloomberg Dollar Rate |
LBMA PM price ($) |
Deviation ((₵)1.00 oz) |
|
25-Nov-24 |
44,403.68 |
44,403.68 |
15.80 |
2,641.85 |
– |
|
31-Dec-24 |
42,989.16 |
40,169.31 |
14.70 |
2,609.10 |
2,819.85 |
|
31-Jan-25 |
45,924.47 |
44,507.86 |
15.30 |
2,787.25 |
1,416.61 |
|
28-Feb-25 |
47,465.86 |
46,526.69 |
15.50 |
2,880.80 |
939.17 |
|
28-Mar-25 |
50,361.63 |
49,250.81 |
15.50 |
3,056.55 |
1,110.82 |
|
30-Apr-25 |
54,456.07 |
48,900.28 |
14.25 |
3,305.05 |
5,555.79 |
|
30-May-25 |
54,577.17 |
35,696.75 |
10.30 |
3,312.40 |
18,880.42 |
|
HPR% |
22.91% |
-19.61% |
-34.81% |
25.38% |
The data presented in the table above illustrates a simulation of GGC prices. In this scenario, rather than converting the currency using an exchange rate to determine the coin’s price locally, we applied the same percentage increase as seen in the LBMA to assess the GGC’s value in local terms.
Conclusion
This report analyzes the performance of the Ghana Gold Coin (GGC) over recent months and highlights numerous significant observations. Introduced by the Bank of Ghana as a novel, gold-supported financial product, the GGC aimed to act as a safeguard against inflation and a means to boost economic stability.
Although it offers some defense against inflationary pressures and currency instability, its pricing structure, which is fixed according to the LBMA gold spot price and adjusted with the current USD/GHS exchange rate, makes it very sensitive to changes in exchange rates.
If the cedi strengthens without a corresponding rise in the international gold price, the domestic worth of the coin diminishes, which can lead to potential financial losses for owners. On the other hand, when the cedi weakens, the value of the coin usually increases.
This engagement established an opposite correlation between the value of the cedi and coin returns, leading to fluctuating prices. Interestingly, although a robust cedi indicates overall economic steadiness, it hampers the effectiveness of the GGC when measured locally, thus discouraging domestic investors who aim for capital appreciation instead of merely safeguarding their wealth.
Moreover, the timing of the GGC’s launch, which aligned with financial difficulties like budget cuts and the Domestic Debt Exchange Programme (DDEP), might have affected how it was initially received.
Throughout this time frame, investor confidence remained subdued, and the elevated cost of the cryptocurrency restricted access for numerous Ghanaians. Consequently, the GGC has predominantly attracted a more limited pool of investors up until now, which hampers its ability to significantly contribute to wider financial inclusivity.
To tackle this issue, launching a GGC-supported mutual fund or unit trust might improve access by enabling people to invest with lower, more affordable sums. Such an initiative would foster wider involvement from various economic brackets and provide a more comprehensive route for participating in gold-backed investments.
Furthermore, this initiative might reduce the reliance on the U.S. dollar as a safe-haven currency by providing a dependable local option, which could lead to increased stability of the cedi over the long term. This setup would also offer investment companies new avenues to gather additional funds and encourage more substantial involvement with gold as an indigenous investment vehicle.
To sum up, although the Ghana Gold Coin adds value as part of the nation’s financial landscape, its overall effect hinges on managing price fluctuations, enhancing access, and ensuring investors’ interests sync with broader economic goals.
Continuous modifications by regulators and investors can assist this digital currency in serving effectively as a trustworthy means of storing wealth and facilitating broader involvement in investment activities.
The author serves as a Research and Investment Analyst at Nimed Capital Limited, is pursuing her Chartered Financial Analyst (CFA) designation, and previously worked as a Research Assistant at the University of Ghana Business School.
Provided by Syndigate Media Inc. ( Syndigate.info ).
Post a Comment